Upload your own plan's data, or explore with sample data
UPLOAD
Upload a file that contains the data elements and order as shown below
or drag and drop here
| AGE | BALANCE | SALARY | DEFERRAL |
| 28 | $42,000 | $35,000 | 4% |
| 37 | $52,000 | $82,000 | 7% |
| 43 | $142,000 | $110,000 | 10% |
EXPLORE
Use PlanVisualizer with sample plan data
Download Excel template Supported file formats:
Provide details about your current plan
The employer matches of contributions up to of salary.
| Auto-enrollment deferral rate: | 3% |
| Auto-enrollment utilization rate: | 88% |
| Auto-increase annual increment: | 1% |
| Auto-increase cap: | 10% |
| Auto-increase utilization rate: | 87% |
Age group
Salary range
Income score
One-year projected matching contributions
| Current plan | New plan | |
|---|---|---|
| Employer Match | ||
| Auto-Enrollment | ||
| Auto-Increase | ||
| Total |
Summary
We project that the will
| One-year projected matching contributions |
Current plan $999.99m |
New plan $999.99m |
| Match contributions up to a | |
| The match formula has | |
| The employer matches | of contributions up to of salary |
| …then matches | of contributions up to the next of salary |
Retirement income replacement rate:
Equity / Fixed income asset allocation ratio:
Current vs. new plan design
| Feature | Current plan | New plan |
|---|---|---|
| Employer match | Not offered | No change |
| Auto-enrollment | Not offered | No change |
| Auto-increase | Not offered | No change |
PlanVisualizer – Frequently Asked Questions
IMPORTANT: The projections generated by PlanVisualizer™ are hypothetical in nature. They are not guarantees of future results and the results may vary with each use and over time. Each simulation takes into account participants’ current plan balance, age, income, contribution rate, likely future savings, and estimated Social Security benefit. PlanVisualizer runs over 50 billion market simulations to provide an estimate of a monthly income likely to be generated at retirement based on participants’ age, plan balance, salary and projected savings. PlanVisualizer is an interactive offering designed for financial advisors and sales and relationship management associates to illustrate the estimated impact of plan design changes on income in retirement. It is important to note that the results from PlanVisualizer are estimates based on most recent data entered. The results are not a guarantee of actual outcomes and will change as your inputs change.
What is the purpose of PlanVisualizer?
PlanVisualizer is an analysis application that estimates plan participants’ ability to replace a portion of their income in retirement based on key factors that may influence their finances in retirement. The key factors used in the estimate of current income needed at retirement include:
- Age
- Retirement age
- Savings rate
- Current savings
- Plan match rules
- Current annual salary
- Income replacement rate
- Mortality assumptions
- Investment mix
- Historical investment performance
PlanVisualizer allows for a range of equity/fixed income investment mixes, including age-based equity/fixed income allocation, with investment returns based on the historical performance of the S&P 500 and Bloomberg Barclays U.S. Aggregate Bond Indexes. While each participant’s actual investment mix and potential outcome are not known, PlanVisualizer attempts to model potential outcomes across the participant population based on the selected equity/fixed income asset allocation ratio.
We rely on the data provided by you, and third parties (such as the Social Security Administration), if applicable, in calculating a retirement income estimate. Actual retirement income will depend on contributions, market performance, as well as other factors. The calculator uses a random number generator to determine which participants to apply plan features such as auto enrollment or auto increase to so the plan cost estimates may vary each time a result is generated.
We are not responsible for the accuracy of the data provided by you, or third parties. As the recipient of this information, you assume full responsibility for using the information, and you understand and agree that we and our affiliates are neither responsible nor liable for any claim, loss, or damage resulting from its use.
We periodically review the PlanVisualizer methodology and reserve the right to change the methodology at any time based on numerous factors, including, but not limited to, current market and portfolio assumptions.
The information provided is intended to serve as an educational offering and is for informational purposes only. It is not intended to provide and should not be relied upon for investment, financial, legal, or tax advice. All figures and projections, simulations, and outcomes are hypothetical and do not reflect actual investment results. Past performance is not a guarantee of future results.
What is used for salary? Does it include bonus?
PlanVisualizer relies on only the annual salary information that you provide.
How are employer contributions treated?
As a plan sponsor, if you make contributions to your participants’ plan, your contributions are based upon the information you enter into the calculator. If applicable, PlanVisualizer will calculate a projected amount of employer contributions based on the assumption that the participant will be eligible for and receive the full amount available under the plan.
How are Social Security benefits calculated?
PlanVisualizer uses the same method used by the Social Security Administration’s Quick Calculator. The Social Security Administration’s calculation includes the participant’s age, current earnings, and a “full” retirement age of 67. For additional details, please review the Social Security Administration’s FAQ. PlanVisualizer uses unisex Social Security life expectancies.
What mortality assumptions are incorporated into the participant readiness calculation?
PlanVisualizer bases mortality on data provided by HealthView Services (HVS). HVS calculates average life expectancy using the 2008 Valuation Basic Table Male and Female ANB (age of nearest birthday). HVS uses published mortality tables to calculate life expectancies at each age, gender, and disease state. To adjust for the differing morbidity levels, HVS uses both published and proprietary information. Data is refreshed periodically to account for health-care changes and assumptions. More can be learned about HVS by visiting its website, www.hvsfinancial.com. Neither we nor our affiliates, including any of our employees, makes any warranty, express or implied, nor assumes any legal liability or responsibility for the accuracy, completeness, or appropriateness of the information and assumptions of any information, data, calculation, or methodology used by HVS.
What investment mix assumptions are incorporated into PlanVisualizer’s calculations?
PlanVisualizer allows for a range of equity/fixed income investment mixes, including age-based equity/fixed income allocation, with investment returns based on the historical performance of the S&P 500 and Bloomberg Barclays U.S. Aggregate Bond Index. While each participant’s actual investment mix and potential outcome are not known, PlanVisualizer attempts to model potential outcomes across the participant population based on the selected equity/fixed income asset allocation ratio.
How does PlanVisualizer work? What is its methodology?
PlanVisualizer is designed to illustrate the estimated effect of participants’ plan balances and projected savings on their ability to receive a portion of their current income in retirement. It uses a confidence level to predict the likelihood of achieving this retirement income goal. Confidence levels used are 90%. A 90% confidence level means that 9 out of 10 simulations run through PlanVisualizer resulted in at least the estimated monthly income being available in retirement.
PlanVisualizer starts with current:
- Ages and salaries
- Retirement plan balances
- Contribution rates
- Retirement age of 67, unisex gender/estimated Social Security benefits
It then runs numerous simulations by looking at a range of retirement present value calculations (see the following section for additional information), based on 50 billion Monte Carlo simulations of real market historical information from 1946 to the present, to estimate how much monthly or annual income participants’ savings may generate upon retirement. The estimated income in retirement, adjusted for inflation so that it can be expressed in today’s dollars, is compared with the estimated income needed in retirement.
The following factors influence the estimate calculated by PlanVisualizer:
- Time: participants’ current age and age 67 retirement.
- Current savings: how much participants have saved currently
- Future savings: based on current contribution rates, how much is likely to be saved in the future
- Current income: the participants’ current salary
- Income replacement rate: the percentage of current annual income to be replaced in retirement
- Equity/fixed income asset allocation ratio: the static or dynamic stock/bond mix applied to each participant
What are the characteristics of the sample plan data that are pre-loaded in PlanVisualizer’s “Explore” option?
The sample plan loaded in PlanVisualizer’s “Explore” option represent 473 participants and $23 million in assets.
Where does PlanVisualizer get auto-enrollment and auto-increase default utilization rates?
The utilization rates are taken from EBRI studies on auto-enrollment and auto-increase features.
What criteria can I change within PlanVisualizer when modeling plan design features?
You may modify the following features for Current and New plan design separately:
- Employer Match: Choose a match of 0% to 100% of contributions, in 5% increments, up to a percentage of salary or specific dollar amount that you enter. You may also add a second tier match.
- Auto-enrollment: Choose a deferral rate from 1% to 10% and a utilization rate from 0% to 100%, in 1% increments.
- Auto-increase: Choose an annual increment from 1% to 3%, a cap from 1% to 20%, and a utilization rate from 0% to 100%, in 1% increments.
Additionally, the following settings allow you to select values which will apply globally across both Current and New plan design:
- Retirement income replacement rate: Select the percentage of current annual income you wish to replace in retirement, from 20% to 100%, in 5% increments
- Equity/Fixed income asset allocation ratio: Select a dynamic allocation based on each participant’s age (e.g., a glidepath), or select a static allocation ranging from 0% equity/100% fixed income to 100% equity/0% fixed income, in 10% increments.
How does PlanVisualizer generate utilization rate?
Each participant that is not enrolled in the plan (deferral = 0%) is assigned a random number between 1 and 100. As you move the slider, everyone assigned the number on the utilization slider or a lower value is changed to participating at the selected contribution rate (e.g., 3, 4, 5%, etc.)
This allows PlanVisualizer to randomly include participants at different ages and salaries in the calculation. The values used to include a participant are randomly generated every time PlanVisualizer is launched. This means you may see slightly different results from session to session.
When viewing certain screens or clicking progress bars, I notice that some boxes are gray and some boxes appear darker than others. What do they signify?
Boxes shaded differently than others represent the impact of plan design changes on participant outcomes. Gray boxes indicate participants who have moved out of a given Lifetime Income Score (LIS) quartile due to changes in plan design, and darker boxes indicate participants who have moved into a new LIS quartile due to those changes.
I’ve noticed that the size and number of the participant LIS progress visualization boxes changes when changing my view between “Age” and “Salary” – why is that?
Because PlanVisualizer categorizes all participants into five age ranges (Under 30; Age 30-39; Age 40-49; Age 50-59; Age 60+) and six salary ranges (Below $50,000; $50,000 to $74,999; $75,000 to $99,999; $100,000 to $124,999; $125,000 to $149,999; $150,000 & Up), the presentation of the data will change between the Age and Salary views.
On the “Dispersion of progress towards goal” screen, some circles have thin borders and others are thicker. Why is that?
Thickness of a circle’s border indicates relative size of a participant’s deferral rate – thinner circles have lower deferral rates and thicker circles have higher deferral rates.
Occasionally it seems that some participants disappear on the “Dispersion of progress towards goal” screen when I click from the “Current plan” view to the “New plan” view. What happened to them?
Sometimes as a result of plan design changes, participants may achieve an LIS greater than 100%. Because the maximum LIS shown on the dispersion chart is 100%, those circles “disappear” from the screen. To determine if there are certain employee age or salary groups who have achieved projected LIS outcomes over 100%, click back two screens to “Average progress towards goal,” where you can view LIS outcomes by employee age and salary groups under the new plan design.
What tax rate assumptions does PlanVisualizer include in its calculations?
There are no tax calculations incorporated within PlanVisualizer.
Does PlanVisualizer make any assumptions about maximum contributions, e.g., does it cap at $18,500 or $19,000?
Yes, it caps contributions at $19,000. It also allows catch-up contributions for those over 50 by increasing the maximum contribution for those employees to $25,000.
What participant data does the “Upload” version of PlanVisualizer use?
PlanVisualizer requires employee age, balance, annual salary, and deferral % in Excel format when accepting uploaded participant data.
Can I save scenarios in PlanVisualizer for later use?
No. Each time you close PlanVisualizer or start a new session, all changes from your previous session are discarded.
How is retirement present value (RPV) calculated?
Retirement present value (RPV) is the value of the retirement plan in today’s dollars. It captures the mortality risk and uncertainty around investment returns by discounting the plan’s future cash inflows and outflows. A positive RPV indicates the likelihood of having assets left over when a participant dies. A negative RPV indicates all assets will be depleted before the participant dies. To calculate individual RPV, PlanVisualizer determines the discounted present value of a participant’s retirement plan’s future cash flows. Mathematically, the equation for probability-weighted discounted cash flow is:
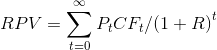
Where:
t = years into the future
Pt = probability of being alive at time t
CFt = cash flow at time t
R = discount rate
Cash flows (CF) of the retirement plan represent savings inflows prior to retirement and outflows from living expenses after retirement. CF0 in the RPV analysis represents current savings at time t=0.
The returns on the investment portfolio in each year are used to determine the discount rate (R). These returns are obtained from historical time series or through a Monte Carlo simulation of historical information from 1946 to the present. This means the discount rate (R) is:
(1+R)t = (1+r1)(1+r2)(1+r3)…(1+rt)
The probability of being alive at time t, (Pt), can be obtained from actuarial tables or through standard mathematical models specified to approximate the actual probability values.
All changes will be lost
Unable to process this file
Please make sure that this file is a supported file type and that the data is formatted as shown on the previous screen.