

Maximize Your Income with Muni Bond Ladders
Calculate potential income from municipal bond ladders with our easy-to-use calculator. Plan your investments to help maximize returns and achieve financial goals.
What is your tax rate?
Build My Ladder
My Ladder
Scenarios
- Estimated incomes and maturities (if any) are based on current yields associated with bond holdings of a model portfolio that are subject to change at any time. Estimated incomes shown are forward looking one year from the run date of this report, assuming that the securities are held for the next twelve months. This information is for illustrative purposes only and should not be construed as investment advice, or recommendations with respect to the model portfolio holdings, and should not be the sole basis for any investment decision. Income estimates can change as portfolio holdings change during the course of active management. Estimated annual income is the sum of the annual income payments for the holdings in the model portfolio. Estimated annual income takes into consideration account size to determine estimated unit values for each security in the model portfolio. Estimated annual income would be lower if fees and expenses were reflected. Income projections can vary depending on the timing of the purchase relative to scheduled coupon/dividend payments; whether bonds are purchased in the primary market as new issue bonds or the secondary market; if the bonds are new issue bonds that pay a deferred or partial initial coupon payment; and/or, bonds that are redeemed prior to their stated maturities due to calls, defaults, pre-refundings or partial pre-refundings.
- Yield-to-Worst, Taxable Equivalent Yield, Coupon and Yield-to-Maturity are calculated without the deduction of fees and expenses.
- The Taxable Equivalent Yield assumes the most recent maximum regular federal income tax, personal sales income tax, and Medicare tax rates.
What's next
Learn more
Explore our SMA-related content
WHAT ARE THE RISKS?
All investments involve risks, including possible loss of principal. Fixed income securities involve interest rate, credit, inflation and reinvestment risks, and possible loss of principal. As interest rates rise, the value of fixed income securities falls. Liquidity risk exists when securities or other investments become more difficult to sell, or are unable to be sold, at the price at which they have been valued. Active management does not ensure gains or protect against market declines. Portfolios focused on a single state are subject to greater risk of adverse economic and regulatory changes than a geographically diversified portfolio.
Bond ladders are subject to market risk and are not guaranteed. A prolonged decline in the bond market can result in a decline in price. Investing in fixed-income securities may involve certain risks, including the credit quality of individual issuers, possible prepayments, market or economic developments and yields and share price fluctuations due to changes in interest rates. Bond portfolio laddering does not reduce market risk, and the principal and yield of investment securities will fluctuate with changes in market conditions.
Western Asset Managed Municipals and Franklin Municipal Enhanced Income: Investments in underlying funds are subject to the same risks as, and indirectly bear the fees and expenses of, the underlying funds.
Western Asset Managed Municipals, Western Asset Municipal Opportunities and Franklin Municipal Enhanced Income: Low-rated, high-yield bonds are subject to greater price volatility, illiquidity and possibility of default.
Western Asset Current Market Muni ESG and Franklin Municipal Green Bond: The managers' environmental, social and governance (ESG) strategies may limit the types and number of investments available and, as a result, may forgo favorable market opportunities or underperform strategies that are not subject to such criteria. There is no guarantee that the strategy's ESG directives will be successful or will result in better performance.
Franklin Municipal Ladders - Tax Managed strategies: Tax Management practices may impact performance, portfolio characteristics and holdings; and may not result in favorable outcomes.
IMPORTANT INFORMATION
Any information, statement or opinion set forth herein is general in nature, is not directed to or based on the financial situation or needs of any particular investor, and does not constitute, and should not be construed as, investment advice, forecast of future events, a guarantee of future results, or a recommendation with respect to any particular security or investment strategy or type of retirement account. Investors seeking financial advice regarding the appropriateness of investing in any securities or investment strategies should consult their financial professional.
Separately managed accounts (SMAs) are investment services provided by Franklin Templeton Private Portfolio Group, LLC (FTPPG), a federally registered investment advisor. Client portfolios are managed based on investment instructions or advice provided by affiliated subadvisors of Franklin Templeton. Management is implemented by FTPPG, the designated sub-advisor or, in the case of certain programs, the program sponsor or its designee.
These materials are being provided for illustrative and informational purposes only. The information contained herein is obtained from multiple sources that are believed to be reliable. However, such information has not been verified, and may be different from the information included in documents and materials created by the sponsor firm in whose investment program a client participates. Some sponsor firms may require that these materials be preceded or accompanied by investment profiles or other documents or materials prepared by such sponsor firms, which will be provided upon a client's request. For additional information, documents and/or materials, please speak to your Financial Professional or contact your sponsor firm.
ABOUT THE CALCULATOR
This calculator is an interactive tool used to produce simulations and statistical analysis representing various investment outcomes. Projections or other information generated by the Franklin Templeton Municipal Bond Ladder Calculator are hypothetical in nature and do not reflect actual investment results that any investor attained nor represent any specific Franklin Templeton product. Any references to future returns should not be construed as a forecast of the results a client may achieve.
The use of this calculator is for educational purposes only and should not be considered investment, legal, financial planning, or tax advice. Simulations and statistical analysis are based, in part, or hypothetical assumptions entered by user. No representation or warranty is made as to the reasonableness of the assumptions made, or that all factors relevant to the investment returns to be achieved have been fully considered. Simulated and hypothetical results have inherent limitations, and no representation is made that any account will, or is likely to, achieve results similar to those indicated. Actual performance results may differ substantially from what is indicated.
Any outputs, yield and returns do not reflect the deduction of management fees, transaction costs and other expenses that an investor will incur. Investors seeking financial advice regarding the appropriateness of investing in any securities or investment strategies should consult their financial professional.
You bear sole responsibility for any decisions you make based on the output of this calculator.
The use of this tool is not a guarantee of future performance.
CUSTOM PORTFOLIO ASSUMPTIONS
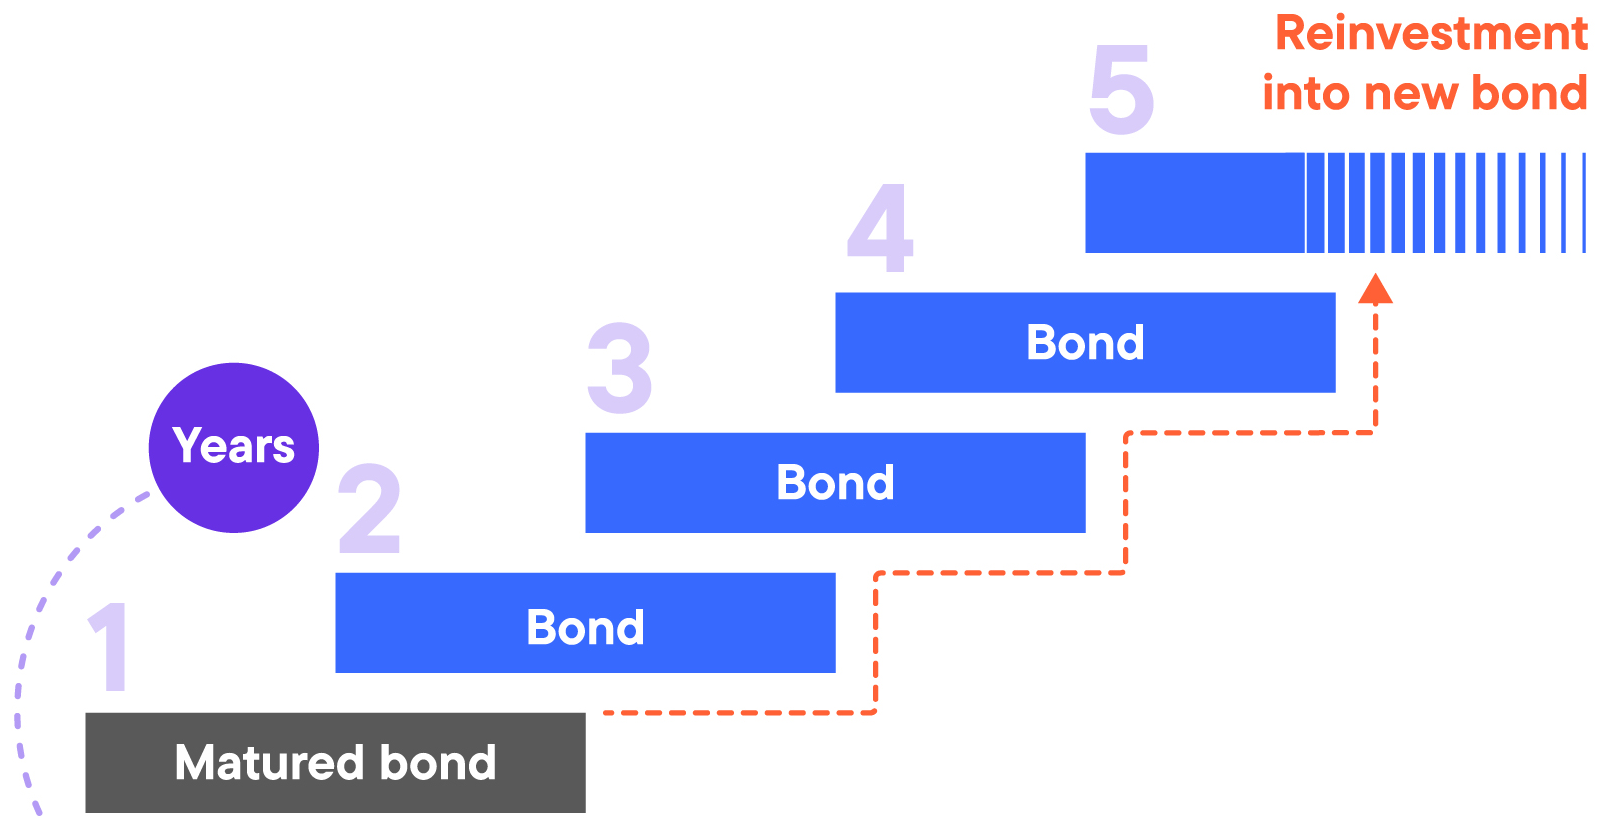
The hypothetical ladder municipal bond portfolio represents equal investments allocated to each maturity of the selected range under the selected state strategy. As the first rung of the ladder matures or rolls down outside the specified ladder range and needs to be sold, additional bonds are purchased on the furthest rung of the ladder using those proceeds. It is assumed that bonds have a 5% coupon and a yield-to-worst that matches the weighted average yield curve corresponding to the appropriate maturity and credit quality (if applicable). Users can choose to 1) reinvest their annual coupon income, 2) withdraw their annual income, or 3) withdraw their annual tax-exempt income. Reinvestment of coupon income assumes that the coupon income from year n is reinvested in the furthest rung of the ladder. Withdraw of tax-exempt income assumes that the difference between the coupon income and tax-exempt income from year n is reinvested in the furthest rung of the ladder. The reinvestment amounts may depend on the inputs in the interest rate scenario.
TAX INFORMATION
Franklin Templeton, its affiliates, and its employees are not in the business of providing tax or legal advice to taxpayers. These materials and any tax-related statements are not intended or written to be used, and cannot be used or relied upon, by any such taxpayer for the purpose of avoiding tax penalties or complying with any applicable tax laws or regulations. Tax related statements, if any, may have been written in connection with the "promotion or marketing” of the transaction(s) or matter(s) addressed by these materials, to the extent allowed by applicable law. Any such taxpayer should seek advice based on the taxpayer's particular circumstances from an independent tax advisor.
Investors should contact their tax advisor regarding the suitablity of tax-exempt investments in the portfolio. If sold prior to maturity, municipal securities are subject to gain/losses based on the level of interest rates, market conditions and the credit quality of issuer. Income may be subject to the alternative minimum tax (AMT) and/or state and local taxes, based on residence. Income from municipal bonds held by a portfolio could be declared taxable because of unfavourable changes in tax laws, adverse interpretations by the Internal Revenue Service or state tax authorities, or noncomplaint conduct of a bond issuer.
© 2025. Franklin Templeton.