

The word seems to be spreading that small- and micro-cap stocks have so far been enjoying a stellar 2026. What seems less well known is that the current cycle of market leadership for the two asset classes stretches back to 2025 and has been in place for 14 months.
After more than a decade that saw mostly positive performance that nonetheless consistently lagged large- and mega-cap stocks, small- and micro-cap stocks have been on a tear since last April. For example, for the one-year period ended May 31, 2026, the small-cap Russell 2000 Index was up 43.1%, and the Russell Microcap Index advanced 62.5% versus respective gains of 28.8% and 29.3% for the large-cap Russell 1000 Index and the mega-cap Russell Top 50 Index.
Results off the US market low in early April of last year have been even more impressive. From April 8, 2025 to June 8, 2026, the Russell 2000 gained 64.6%. The Russell Microcap did even better, notching a 91.1% increase, compared to a 50.3% return for the Russell 1000 and 51.1% for the Russell Top 50.
One question is whether or not these robust performances over the last several months have made small- and micro-cap stocks a little too expensive, especially for investors who may just now be trying to make decisions about their equity investments. It’s certainly an understandable concern, particularly when barely a day goes by without a warning about a bubble in equity prices. We saw the last round of worrying at the end of last week’s deep and sudden sell off. In addition, a number of market observers have been drawing parallels between the current AI-driven rally and the Internet bubble of 2000-2001. We would understand, then, why some investors might hesitate before deploying any more capital in US stocks.
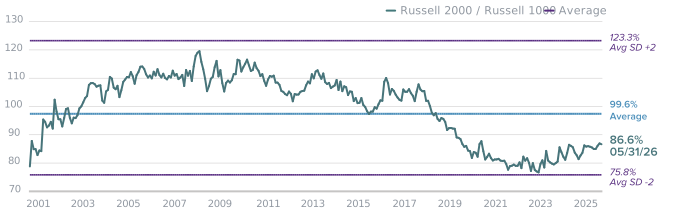
Perhaps unsurprisingly given our position as experienced small-cap specialists (along with our often contrarian nature), we have a decidedly different point of view. Importantly, our view is grounded in data—specifically our preferred index valuation measure (which we use when evaluating individual companies as well): EV/EBIT, or enterprise value over earnings before interest and taxes. As the chart below shows, valuations for small-cap versus large-cap, even after more than a year of robust returns, were still close to their lowest levels versus the Russell 1000 in 25 years at the end of May.
Relative Valuations for Small-Caps vs. Large-Caps Remain Near Their Lowest in 25 Years
Russell 2000 vs. Russell 1000 Median LTM EV/EBIT (ex. Negative EBIT Companies), May 31, 2001-May 31, 2026
Source: FactSet. Past performance is no guarantee of future results.
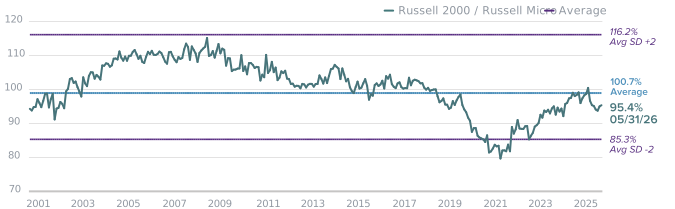
In light of how well micro-caps have done, we ran the same data for the Russell Microcap versus the Russell 1000 to see if the picture was appreciably different. What we found, however, shows that micro-caps finished May still below their long-term average versus the large-cap index.
Relative Valuations for Micro-Caps vs. Large-Caps Remain Below Their Long-Term Average Over the Last 25 Years
Russell Microcap vs. Russell 1000 Median LTM EV/EBIT (ex. Negative EBIT Companies), May 31, 2001-May 31, 2026
Source: FactSet. Past performance is no guarantee of future results.
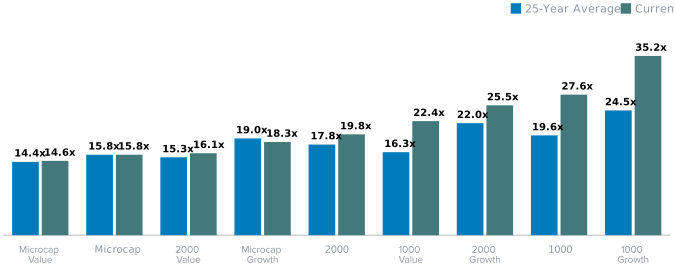
We then looked at valuations for the three indexes at the level of style to see if value or growth were significantly cheaper or more expensive than their long-term EV/EBIT averages. What we found was that small- and micro-cap value and micro-cap core are the cheapest segments of the US equity market and that these segments are either just below or slightly above their 25-year average valuation; while all three value segments have somewhat similar 25-year average valuations, their current valuations are vastly different; and overall large-cap valuations still have a long way to fall to reach their 25-year average valuations.
The Russell Microcap Value, Russell Microcap, Russell 2000, and Russell 2000 Value Remain Near Their Historical Averages
Current and 25-Year Average Median EV/EBIT (ex. Negative EBIT) Levels for Russell Indexes as of May 31, 2026
Source: FactSet.
Of course, relatively attractive valuations are seldom enough to keep an asset class in a leadership position. Earnings growth is what ultimately drives long-term returns—and the news remains positive on this front as well, with earnings fundamentals continuing to improve for many small- and micro-cap companies. More and more smaller businesses are emerging from a multi-year earnings recession, and consensus estimates are pointing to faster earnings growth ahead (as they have for several months).
Equally important, most of our investment teams are enjoying a sweet spot between seeing many holdings perform well while also finding what they think are excellent long-term opportunities in the wide and diverse selection universe that encompasses small- and micro-cap stocks. To this point, we think it’s important to note that, while much is made of the fact that more than 40% of the companies in the Russell 2000 have no earnings, the small- and micro-cap universe still has more profitable companies than the Russell 1000 or S&P 500 Indexes.
This combination of more attractive valuations and ongoing earnings strength informs our conviction that the current environment continues to offer many compelling opportunities for active, fundamentals-driven investors with a long-term horizon.
Stay tuned...
Follow Francis D. Gannon

Definitions
The S&P 500 Index is an unmanaged index of 500 stocks that is generally representative of the performance of larger companies in the United States.
The Russell 1000 Index is an unmanaged, capitalization-weighted index of domestic large-cap stocks. It measures the performance of the 1,000 largest publicly traded US companies in the Russell 3000 Index.
The Russell 2000 Index is an index of domestic small-cap stocks that measures the performance of the 2,000 smallest publicly traded US companies in the Russell 3000 Index.
The Russell Microcap Index measures the performance of the microcap segment of the US equity market. Microcap stocks make up less than 3% of the US equity market (by market cap) and consist of the smallest 1,000 securities in the small-cap Russell 2000® Index, plus the next smallest eligible securities by market cap.
Enterprise value (EV) refers to the entire value of a company after taking into account both holders of debt and equity.
The EV/EBIT multiple is the ratio between enterprise value (EV) and earnings before interest and taxes (EBIT).
WHAT ARE THE RISKS?
All investments involve risks, including possible loss of principal. Past performance is no guarantee of future results. Please note that an investor cannot invest directly in an index. Unmanaged index returns do not reflect any fees, expenses or sales charges.
Active management does not ensure gains or protect against market declines.
Equity securities are subject to price fluctuation and possible loss of principal.
Commodities and currencies contain heightened risk that include market, political, regulatory, and natural conditions and may not be suitable for all investors.
Small- and mid-cap stocks involve greater risks and volatility than large-cap stocks.
US Treasuries are direct debt obligations issued and backed by the “full faith and credit” of the US government. The US government guarantees the principal and interest payments on US Treasuries when the securities are held to maturity. Unlike US Treasuries, debt securities issued by the federal agencies and instrumentalities and related investments may or may not be backed by the full faith and credit of the US government. Even when the US government guarantees principal and interest payments on securities, this guarantee does not apply to losses resulting from declines in the market value of these securities.
Any companies and/or case studies referenced herein are used solely for illustrative purposes; any investment may or may not be currently held by any portfolio advised by Franklin Templeton. The information provided is not a recommendation or individual investment advice for any particular security, strategy, or investment product and is not an indication of the trading intent of any Franklin Templeton managed portfolio. Past performance does not guarantee future results.
Any data and figures quoted in this article (unless stated) are sourced from FTSE Russell, FactSet, Bloomberg and Reuters.
Important data provider notices and terms available at www.franklintempletondatasources.com. All data is subject to change.
WF: 10981161


